Environmental sustainability management
Energy conservation, carbon reduction, and the lowering of environmental impact
Chroma has built an environmental management system (EMS) to address global climate change and develop green design to help lower environmental impact. The increase in human activities, the loss of energy and various resources and climate change have become major issues that the world must face. The greenhouse effect causes climate change and extreme weather as well as serious natural disasters. The use of vast amounts of energy and the excessive development and use of water resources, exhaust gases and the huge amounts of waste that pollute the land, the water sources and the oceans, are all seriously affecting our planet and impacting human activities and life. Extraordinarily heavy rainfall, caused by extreme fluctuations of temperature, is also occurring more frequently. Gaining a firm grasp of associated risks and seeking potential opportunities is an indispensable part of the pursuit of sustainable development.
Environmental sustainability management

Environmental policy
Chroma has obtained ISO 14001:2015 environmental management system certification, covering all four of its operating sites (100% coverage). Through the implementation of the Plan-Do-Check-Act (P-D-C-A) management cycle, all pollution sources are managed under standardized procedures and in compliance with legal and regulatory requirements, thereby enhancing environmental performance and strengthening the environmental management system. To ensure the credibility of the quantified data of GHG inventory, third-party verification of ISO 14064-1:2018 was obtained. Chroma addresses climate change, green products and design, and pollution prevention through three key areas of focus, while promoting environmental awareness across the entire organization. With a product life cycle perspective, the Company implements comprehensive management from product design, raw material sourcing, manufacturing processes, and plant operations to end products, after-sales services, and proper legal disposal of waste. This approach aims to minimize negative impacts on climate change and environmental harm throughout the entire product life cycle.
Nature and Biodiversity
To fulfill its corporate social responsibility, Chroma is committed to taking action within its operations to implement the concept of sustainable management. The Company remains focused on sustainability issues over the long term and calls on its supply chain partners to respond and support these efforts. It also emphasizes the importance and value of biodiversity (Biodiversity) and zero deforestation (Zero Deforestation), with the Board of Directors serving as the highest governance and supervisory body. At the same time, the Company has also issued the Chroma Biodiversity and Zero Deforestation Policy , signed by the CEO.
In recent years, climate change and biodiversity loss have led to a rapid depletion of natural resources. “Biodiversity” not only reflects the richness of life on Earth but also maintains ecosystem balance, affecting key ecological services such as climate regulation, water cycling, soil fertility, agricultural productivity, and human health. In 2022, countries around the world reached a consensus at the 15th Conference of the Parties to the Convention on Biological Diversity (COP15) to adopt the new Global Biodiversity Framework (GBF), which provides targets and guidance for biodiversity policies and actions worldwide through 2030. Chroma recognizes the importance of restoring and conserving biodiversity. The Company is committed to protecting biodiversity and minimizing its impact during the production process, striving to achieve a net positive impact (NPI). Chroma firmly believes that beyond pursuing business growth and revenue, continuous innovation, ongoing improvement, gradual implementation, and actively creating positive influence are key to achieving longterm corporate sustainability.
Energy Management

Electricity and fuel management
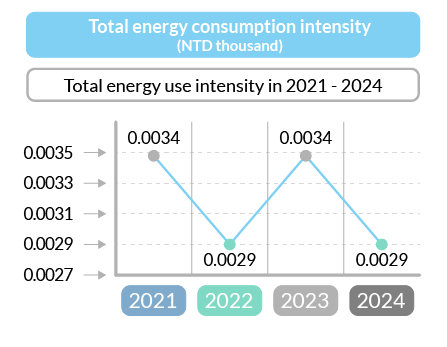
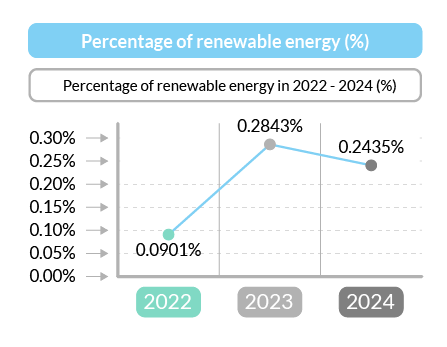
Chroma’s energy use primarily consists of externally purchased electricity. Other fuels include natural gas used in the staff restaurant, dormitory, and health center, as well as gasoline for company vehicles and diesel for generators. The energy statistics for the headquarter (including the Huaya plant), Hsinchu branch, and Kaohsiung branch are summarized in the table below:
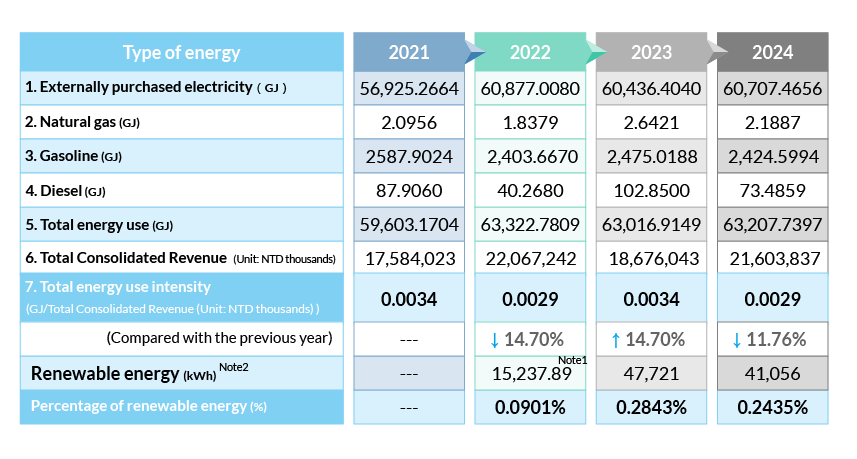
Note 1: Based on contracted capacity and power generation, renewable energy consumption (kWh) has been recorded starting from July 2022.
Note 2: From 2021 to 2023, errors occurred in energy calculations due to incorrect conversion factors when converting various types of energy into joules. The corrected data showed a decrease.
Water R esource Manag ement
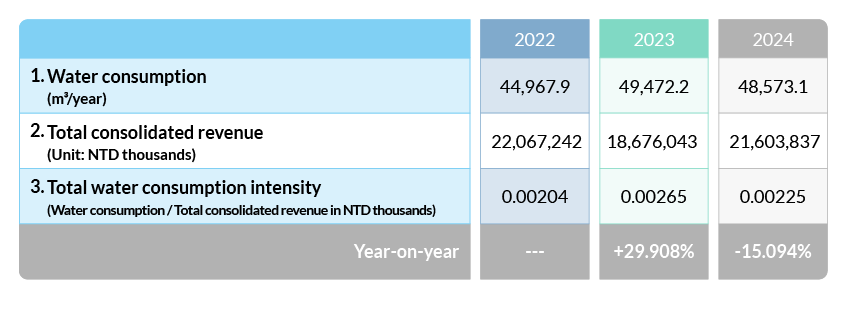
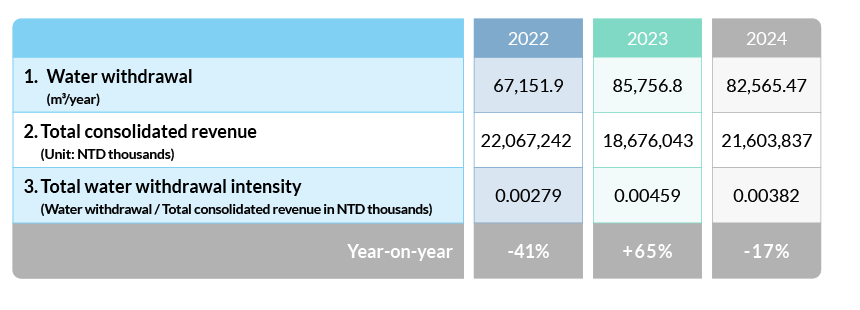
Chroma’s headquarter (including the Huaya plant), Hsinchu branch and Kaohsiung branch are located in Huaya Technology Park, Hsinchu Science Park and Nanzih Processing Zone, respectively; none of which are located in environmental protection areas. Their water supply comes 100% from municipal water (tap water) and not from protected areas or water sources. Because the manufacturing processes primarily involve assembly and testing, there is no significant demand for water. Water usage is mainly for employee daily needs and facility-related equipment, particularly air conditioning systems. As such, it does not pose a significant environmental impact on water resources or the surrounding ecosystems of water sources. Domestic sewage is either treated by appropriate sewage treatment facilities or discharged directly into the sewer system in accordance with legal requirements. Even so, in addition to conserving electricity, we believe that water is also a valuable global resource. Therefore, reducing water consumption and improving water efficiency are also important tasks. To implement water resource management, the head office building has a rainwater harvesting system. After precipitation and treatment, the water is used as a water source for gardening, to achieve the purpose of water resource protection and conservation. The total water consumption intensity in 2024 was 17% lower than that in 2023.
(Headquarter (including Huaya Plant) + Hsinchu Branch +Kaohsiung Branch)
GHG Management

Chroma conducts greenhouse gas (GHG) inventories in accordance with ISO 14061-1:2018 to monitor emissions at its headquarter and all branch offices. Through this inventory process and its results, the Company maintains accurate oversight of its GHG emissions and has proposed feasible reduction measures based on the findings. To enhance the credibility of GHG inventory information and reporting, and to improve the overall quality of the inventory process, internal verification is first conducted within the Company. Following this, an impartial third-party verification body is commissioned to carry out external verification in accordance with relevant standards, thereby establishing a comprehensive inventory process and ensuring the accuracy and reliability of the data.
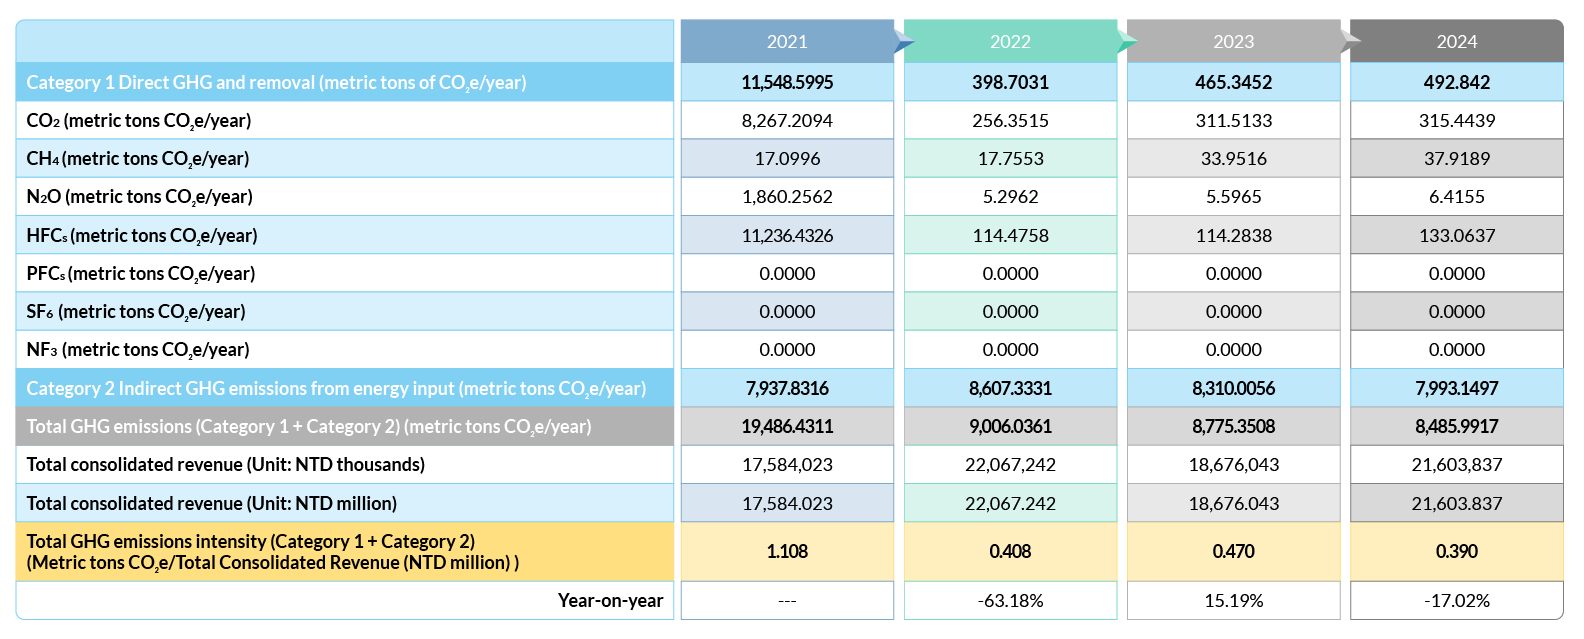
GHG emissions were calculated using the operational control approach and were calculated using the GWP values from the IPCC Sixth Evaluation Report. The inventory covers seven types of greenhouse gases: CO2, CH4, N2O, HFCs, PFCs, SF6, and NF3. The quantification is divided into two main categories: Category 1 refers to direct greenhouse gas emissions, including stationary emissions, process emissions, mobile emissions, and fugitive emissions. Category 2 refers to energy indirect greenhouse gas emissions, which result from the consumption of externally purchased electricity. As ISO 14061-1:2018 was adopted as the new standard for inventory and quantification, the year 2021 was designated as the base year. To effectively monitor GHG emissions, GHG intensity (measured in metric tons of CO2e per NTD million in consolidated revenue) is used as the key management indicator.
For Chroma ATE Inc., since the Company had just relocated to its current site at the end of 2020, the refrigerant emissions were calculated using the filling method. As a result, Category 1 emissions were significantly higher than those of Category 2. As a result, the GHG emissions intensity in 2023 decreased by 54.89% compared to the base year 2021, but increased by 15.19% compared to 2022. The GHG emissions intensity in 2024 was 17.02% lower than that in 2023.
* GHG emissions for Category 1 and Category 2 from 2021 to 2024: (with 2021 as the base year)
* The scope of inventory and quantification includes: Headquarter: Chroma ATE Inc. (excluding areas leased to Dynascan Technology Corp. and Adivic Technology Co.), Huaya Plant and Hsinchu Branch (excluding areas leased to Testar Electronic Corporation) and Kaohsiung Branch
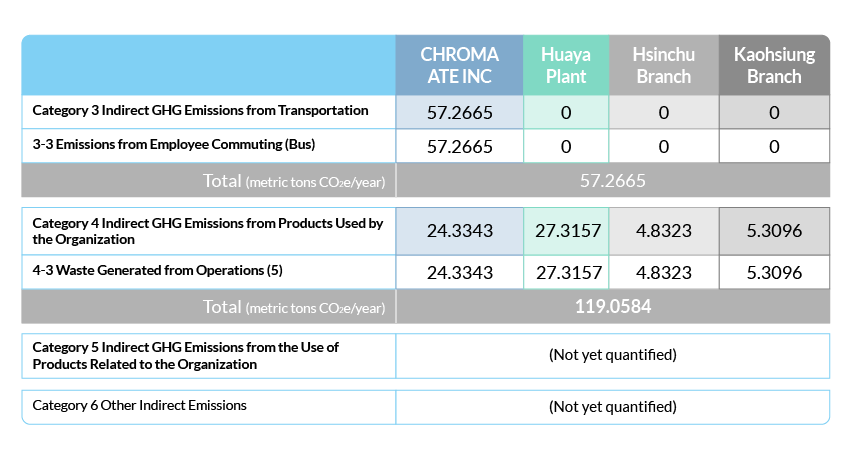
In 2024, for Categories 3 to 6, the other indirect GHG emissions were quantified based on emissions from the disposal of solid and liquid waste. In addition, emissions from employee commuter buses were quantified as follows for the year.
Waste management

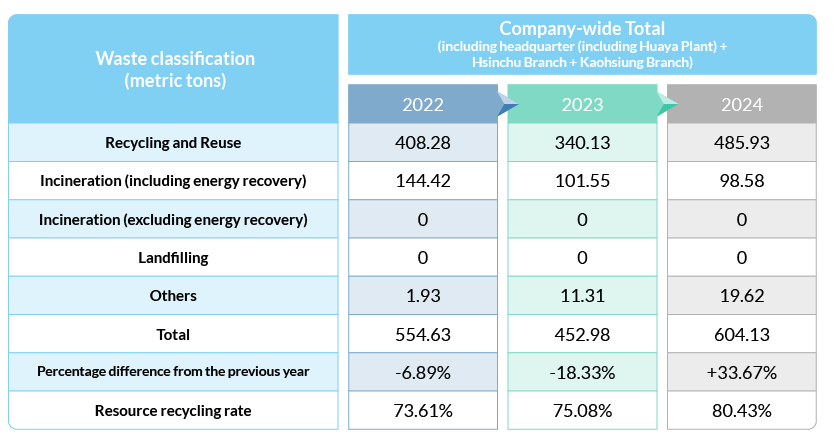
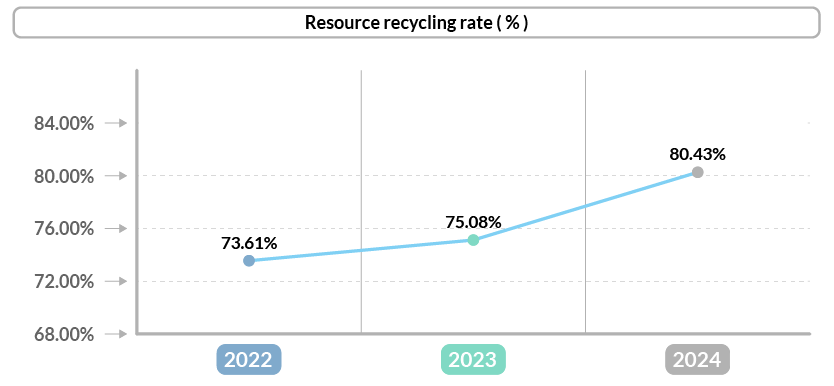
Chroma manages waste at each site primarily through classification, waste and carbon reduction, and pollution prevention. The Company strictly complies with environmental laws and regulations at its operating locations, fully implements waste management policies, and actively reduces waste generation through the purchase, recycling, and reuse of scraps, as well as paid disposal services. We conduct regular audits and disclose our environmental performance results through ISO 14001 certification by a third-party verification agency every year.
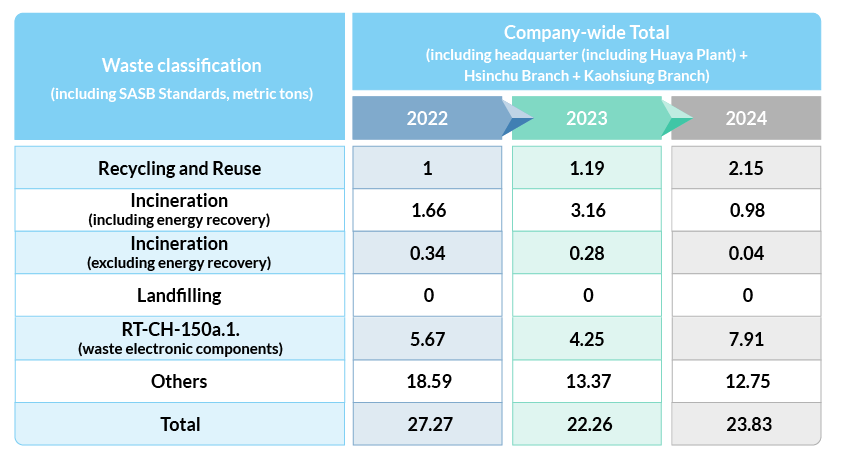
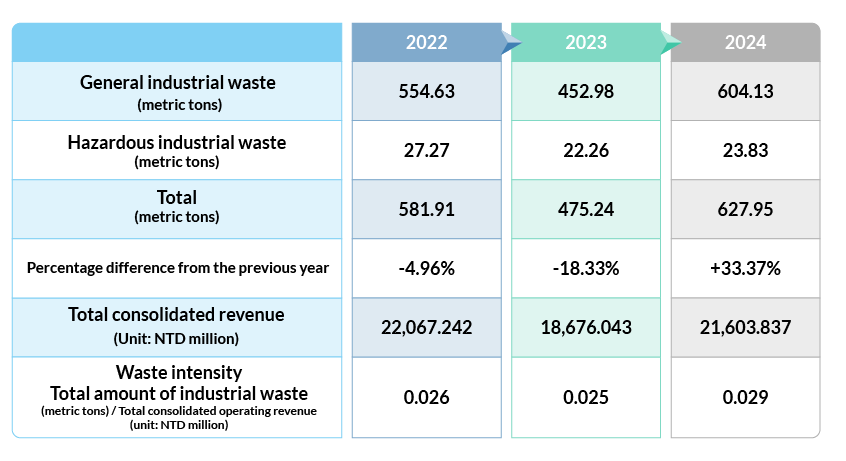
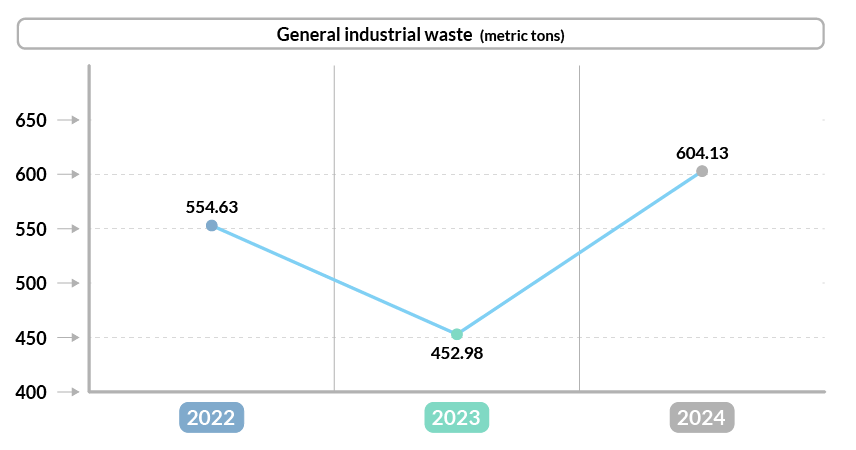
The waste generated during Chroma’s operations includes “general industrial waste” and “hazardous industrial waste.” All industrial waste is handled by licensed contractors in accordance with local regulations, transported off-site for proper treatment, and classified and recorded by weight based on disposal manifests and weighbridge data. General industrial waste is reused or otherwise treated based on its category, while “hazardous industrial waste” is rendered harmless in accordance with local regulations. Investigations have confirmed that Chroma ATE’s sites do not generate process wastewater or process exhaust gases (acidic, alkaline, or volatile organic compounds VOCs). In addition, we promote the concept of “resource recycling and waste reduction” at all sites to encourage company-wide waste reduction from the inside out.
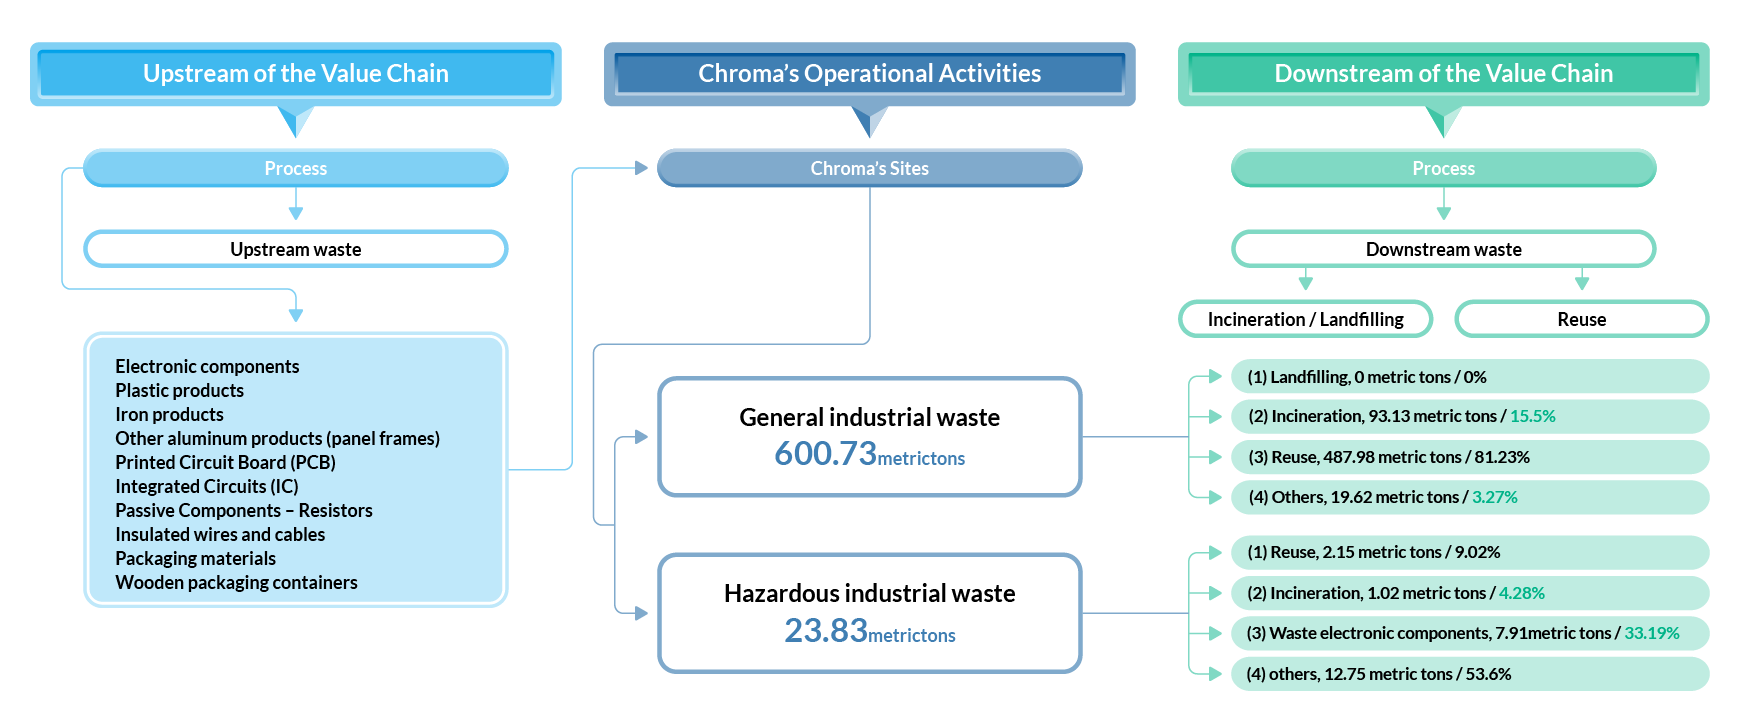
Including waste plastics, waste wiping cloths, waste paper, waste iron, waste aluminum, waste tin, spent activated carbon, employee domestic waste, food waste, and waste lighting sources
Reduction Actions and Results

To achieve the goals of “reaching net-zero emissions at all office sites by 2030 and at all facilities by 2050,” Chroma will increase the use of renewable energy. At the end of 2024, the Company signed a green power wheeling agreement with a renewable energy provider. The agreement is expected to supply 900 thousand kWh of green electricity in the first year, accounting for 5% of total electricity consumption. Starting in 2025, Chroma plans to increase the proportion of green electricity by an average of 5% each year, aiming to achieve RE30 by 2030.
In 2024, through process optimization and smart manufacturing, Chroma not only achieved energy savings and carbon reduction but also improved production efficiency, reducing carbon emissions by 134 metric tons of CO2e. (saving 270,921 kWh) ( at 0.494 kg CO2/kWh).
Reduction Actions & Specific Energy-Saving Measures
- For power measurement instruments, energy-efficient equipment is used during the product burn-in process. Intelligent monitoring and data analysis are implemented, with monthly analysis reports generated to quickly adjust and reduce burn-in time, thereby minimizing energy consumption.
- In 2024, new products featured energy recovery functions that enabled power sharing and load burn-in, reducing electricity consumption during the burn-in process by approximately 50%. (Burn-in time was reduced from 24 hours to 12 hours)

